Welcome to the Bigman Geophysical Quick Start Series. This post is part of our ongoing collection of free, field-ready guides designed to get your team up and running without the fluff. We believe in "frictionless training"—proving that when you pair intuitive hardware setups with live-visual software, you drastically reduce ramp-up time and minimize human error. These guides are built to get your crew scanning with confidence from day one, and Bigman Geophysical offers affordable online courses and in-person workshops to expand on the free knowledge base to take your team's field competency to the next level.
Deep Dive into Concrete: A Quick Start Guide to the Proceq PD8050 Ultrasonic Pulse Echo
When evaluating concrete structures, sometimes Ground Penetrating Radar (GPR) isn't the only tool you need—especially when navigating dense rebar grids or evaluating internal concrete health. For deep internal structural imaging, civil and structural engineers turn to Ultrasonic Pulse Echo (UPE) technology.
The Screening Eagle Proceq PD8050 is a premier multichannel ultrasonic pulse echo unit built specifically for advanced concrete scanning. Whether you are mapping out embedded steel rebar, locating deep post-tension (PT) cables, or searching for internal structural defects, this guide will get your team mastering the fundamentals of the PD8050 in record time.
Step 1: Physical Setup and App Connectivity
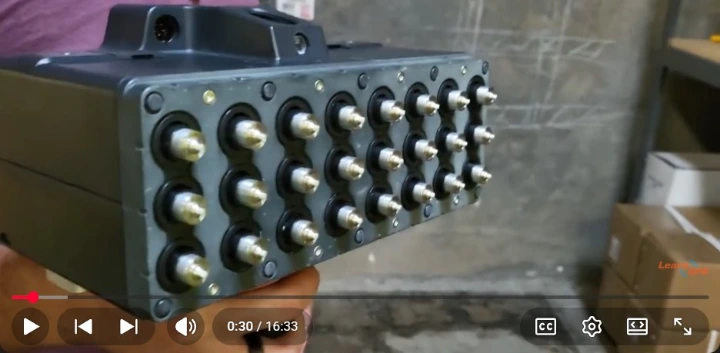
Unlike traditional single-transducer units, the PD8050 features a sophisticated multichannel array that significantly speeds up field data collection without compromising accuracy.
Prep the Transducers: Inspect the dry-contact shear wave transducers on the bottom of the unit. Ensure they are clean and free of heavy dirt or grit.
Connect the Interface: Power up the PD8050 and sync it wirelessly via Wi-Fi or Bluetooth to your iPad/tablet controller running the Screening Eagle software ecosystem.
Establish Your Scan Path: Mark your scanning area on the concrete surface. Because UPE requires firm, direct contact with the concrete, starting with a clean, clear track ensures consistent data flow.
Step 2: Velocity Calibration
In ultrasonic testing, accuracy depends entirely on acoustic velocity. Sound waves travel through concrete at different speeds depending on its density, age, and internal mix design.
Measure Known Thickness: If you already know the exact thickness of a specific slab section, input it into the system to calibrate the device instantly.
Perform a Pulse Velocity Test: Follow the software's step-by-step calibration sequence to measure how fast the acoustic waves return through the material. Getting this velocity setting right ensures that the depth estimates for rebar or defects on your final scan are highly accurate.
Step 3: Real-Time Data Collection
With calibration complete, you are ready to begin scanning. The PD8050 allows for efficient, real-time visualization of what lies beneath the concrete surface.
Maintain Stable Contact: Firmly press the unit against the concrete surface. The specialized dry-contact channels mean you don't need messy coupling gels, but applying uniform pressure across all channels is key for clean data.
Capture the Scan: Move the array systematically along your marked survey line or grid points, allowing the software to build a continuous profile.
Identify Internal Features: Watch the real-time B-scan imaging on your tablet. Look for distinct acoustic reflections indicating embedded rebar, deeper post-tension ducts, or the back-wall boundary of the slab.
Pro-Tip for Defect Detection: Keep an eye out for acoustic shadows or sudden, early scattered reflections. A sharp drop-off in the signal or an unusual hyper-reflective patch typically signals an internal structural defect, such as honeycombing voids or delamination.
Step 4: Interpretation and Reporting
Once your measurements are recorded, the accompanying software turns the raw acoustic data into highly intuitive visual maps.
Tomographic Processing: Leverage the software's built-in 3D visualization tools to view cross-section slices of the concrete at various depths.
Tag Components: Annotate your findings directly in the software, marking out structural rebar spacing versus deep PT conduits.
Export for Clients: Generate professional field reports detailing concrete health and target locations, which can be shared straight from the app to structural engineers or project managers.
See the Proceq PD8050 in Action
Want to see this exact process deployed live? Watch the full video guide below by LearnGPR to master the basic hardware setup, velocity calibration steps, and data collection techniques on real concrete.